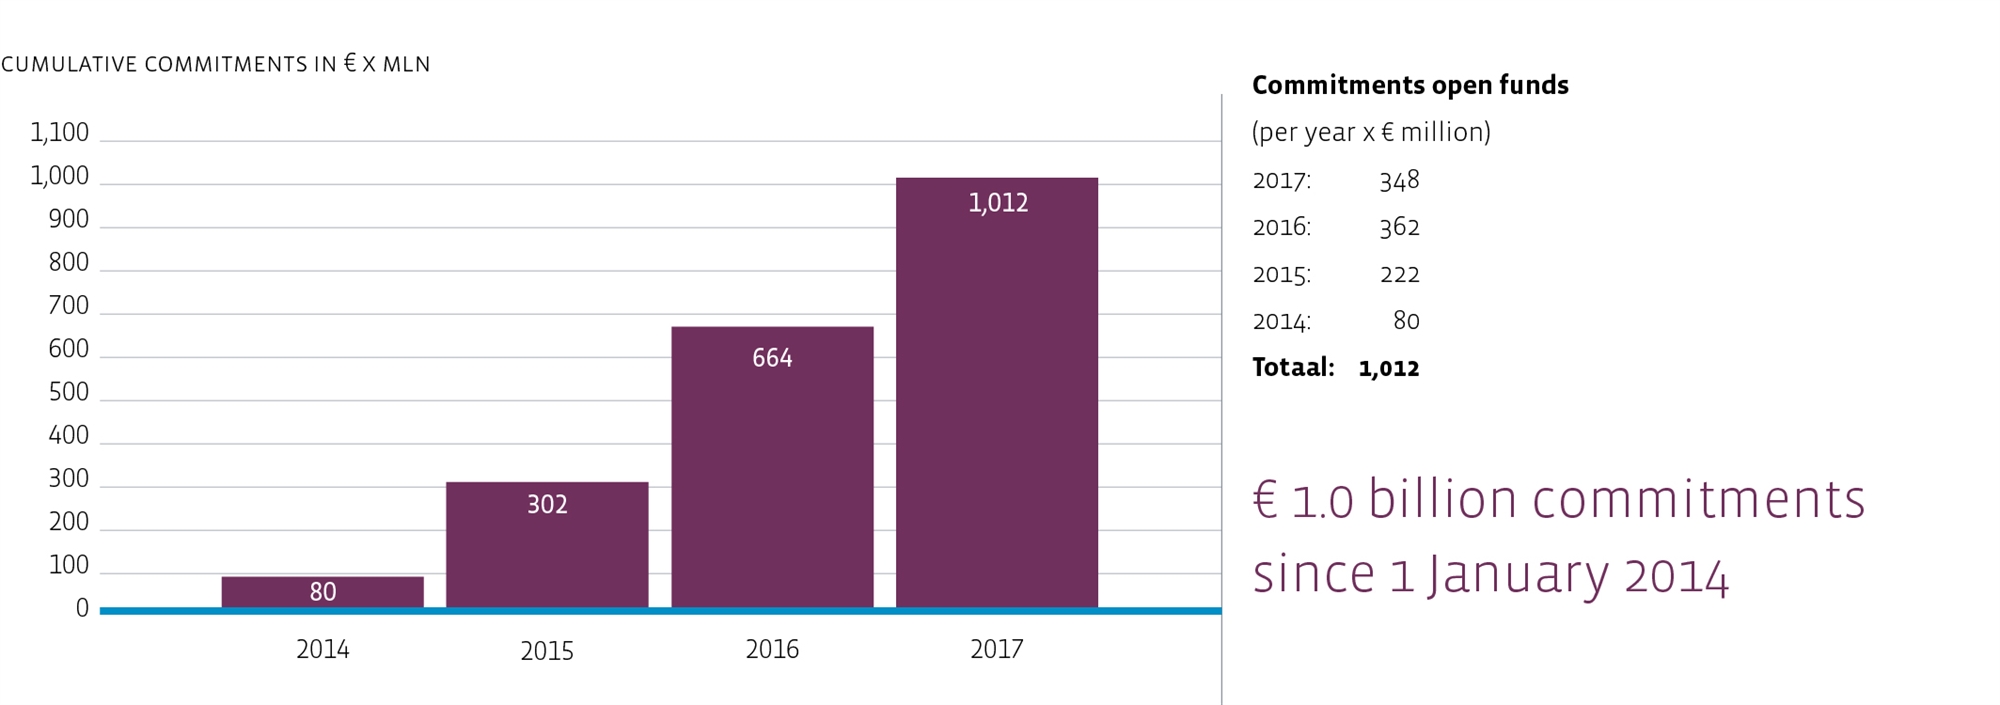
Funding
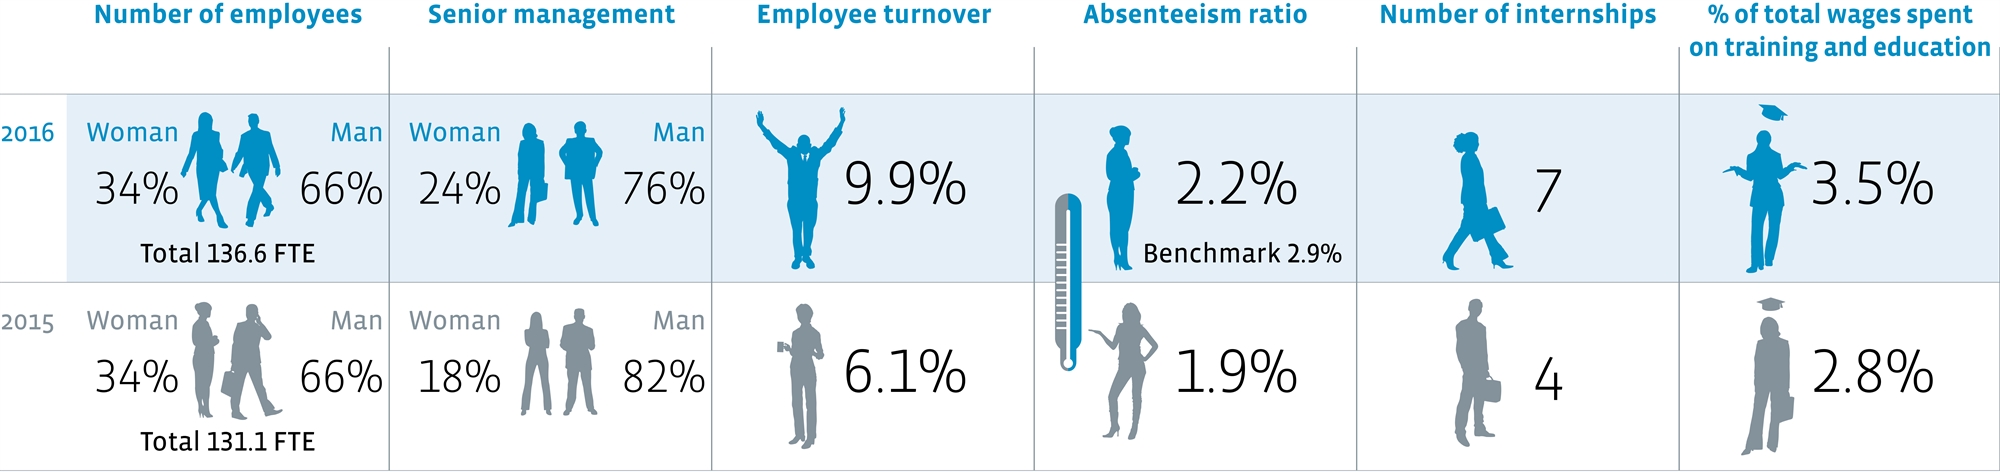
Bouwinvest employees
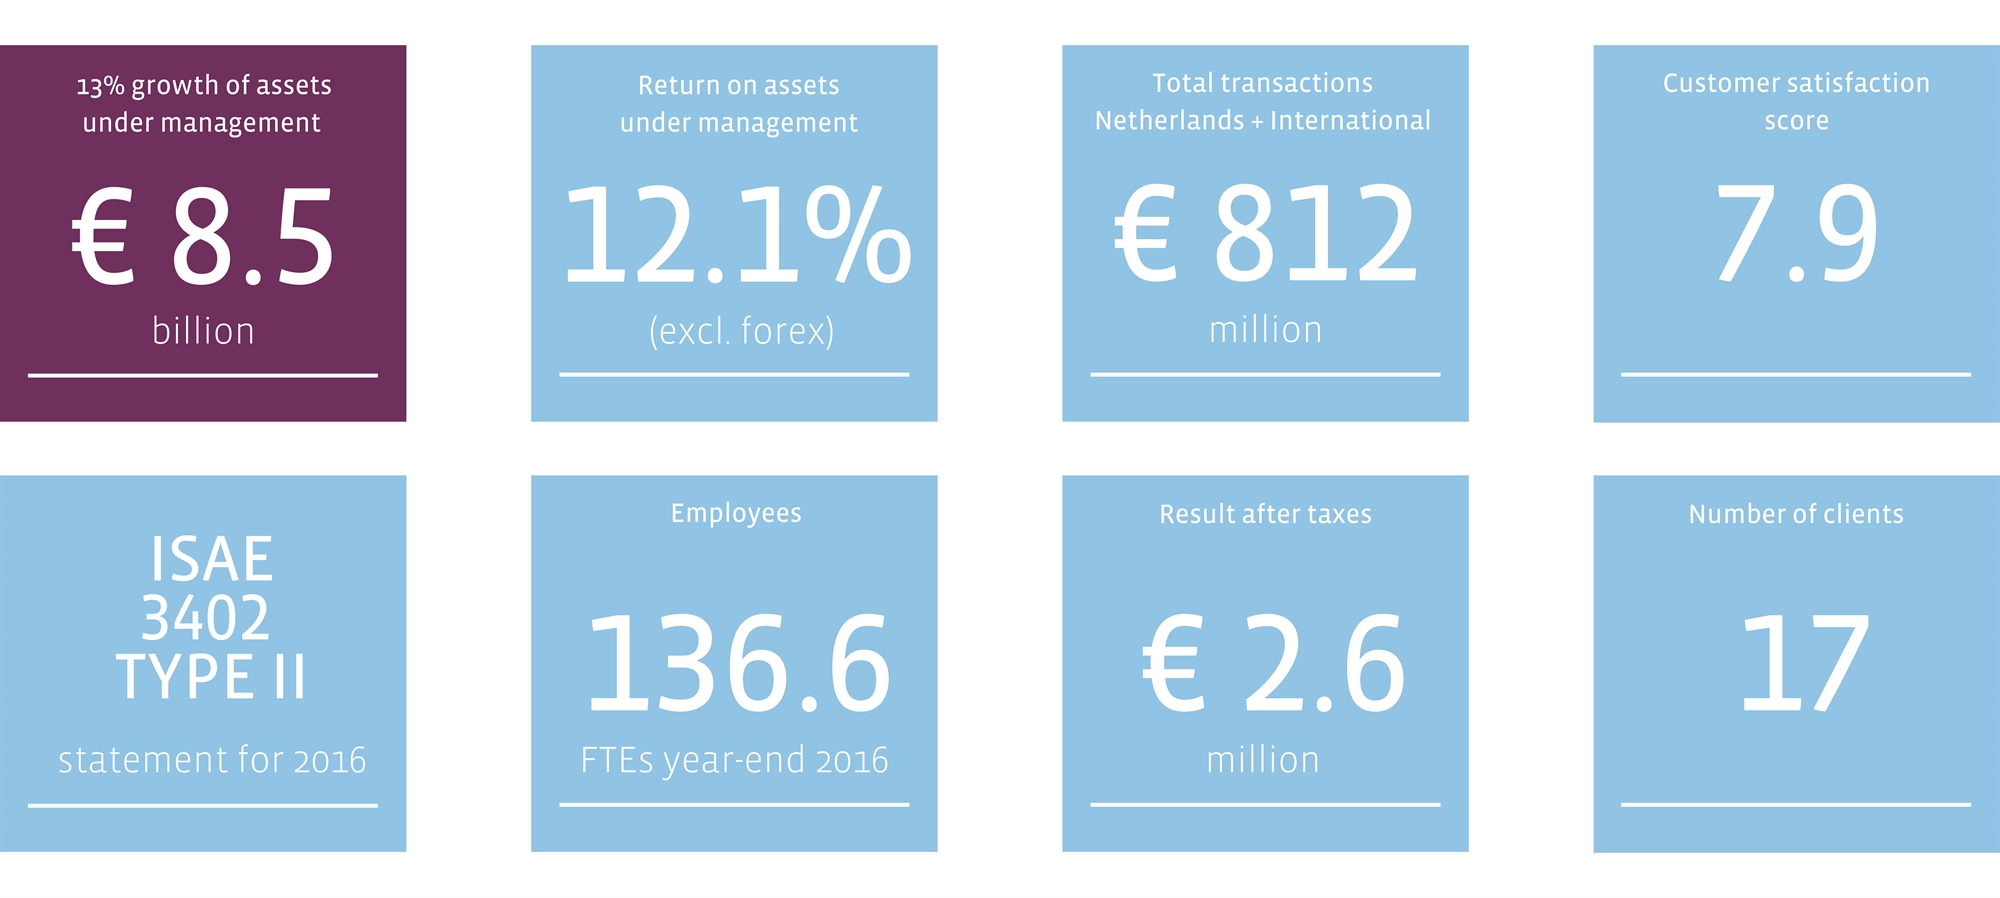
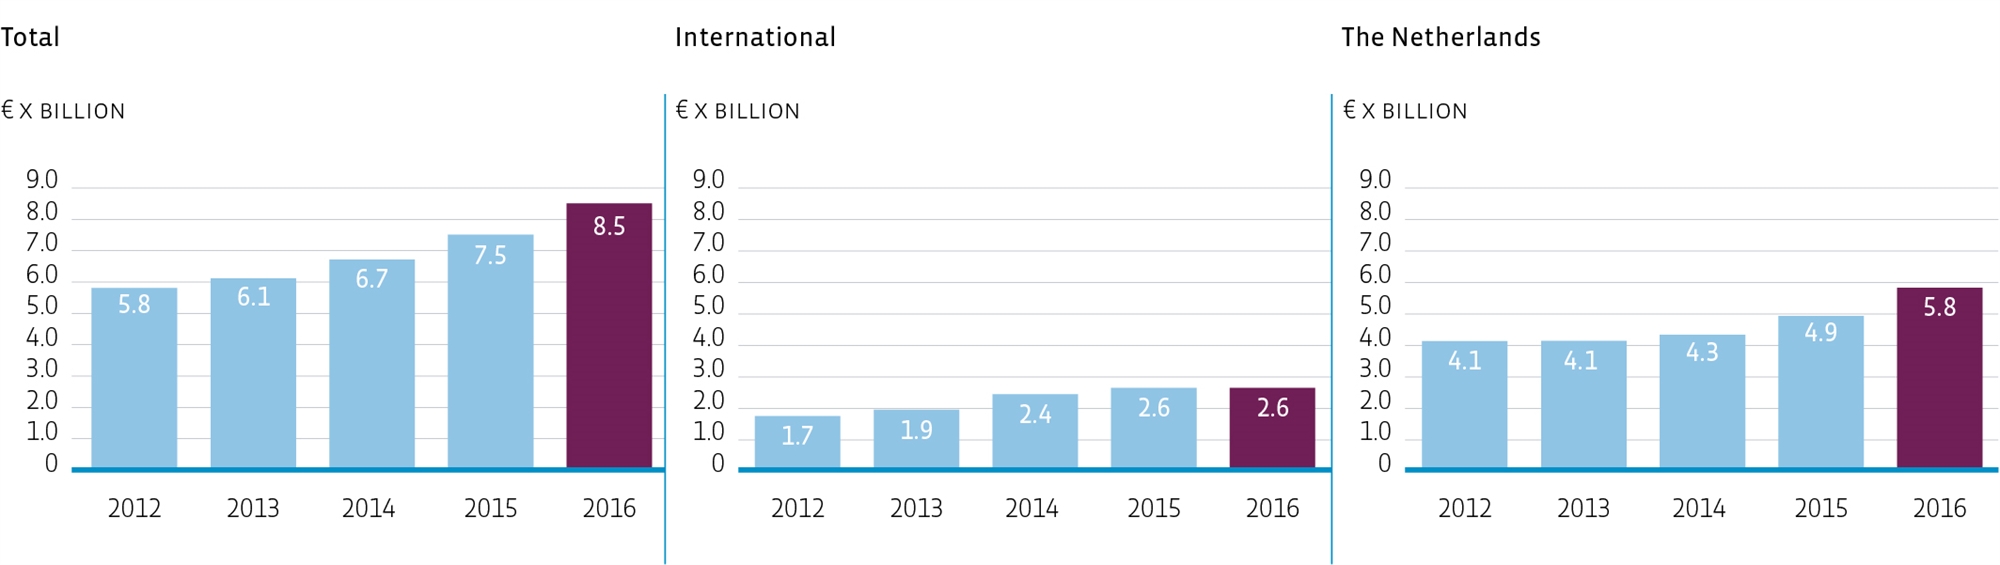
Assets under management
Distribution assets under management total portfolio
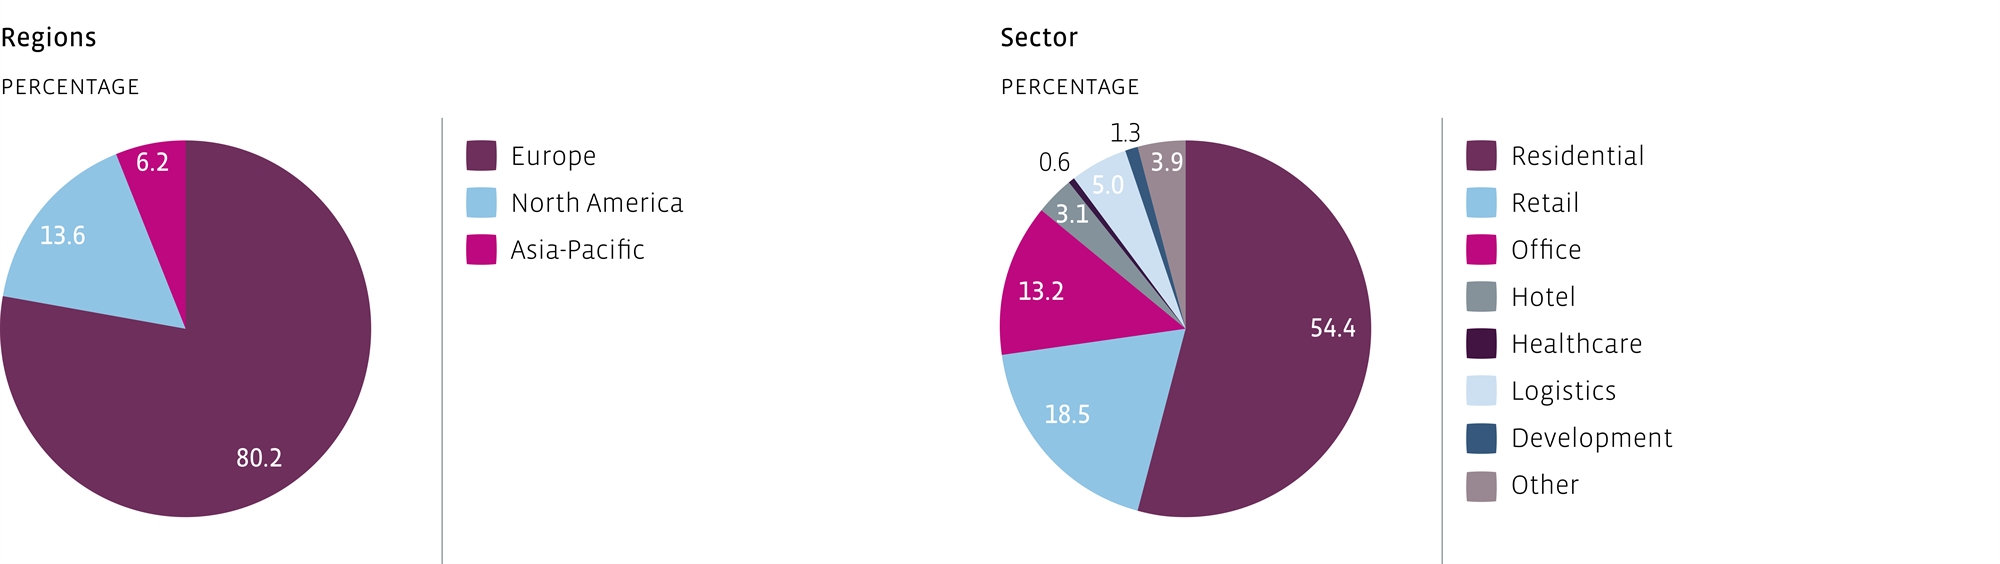
Distribution assets under management Dutch funds and mandate international real estate
x € thousands, unless otherwise stated
| | 2015 | 2016 |
Residential Fund | 3,151,198 | 3,995,034 |
Retail Fund | 738,335 | 824,201 |
Office Fund | 554,723 | 525,988 |
Hotel Fund | 147,923 | 189,232 |
Healthcare Fund | 34,066 | 53,733 |
Separate mandate International real estate | 2,617,936 | 2,629,023 |
Other | 251,144 | 239,658 |
| | 7,495,325 | 8,456,869 |
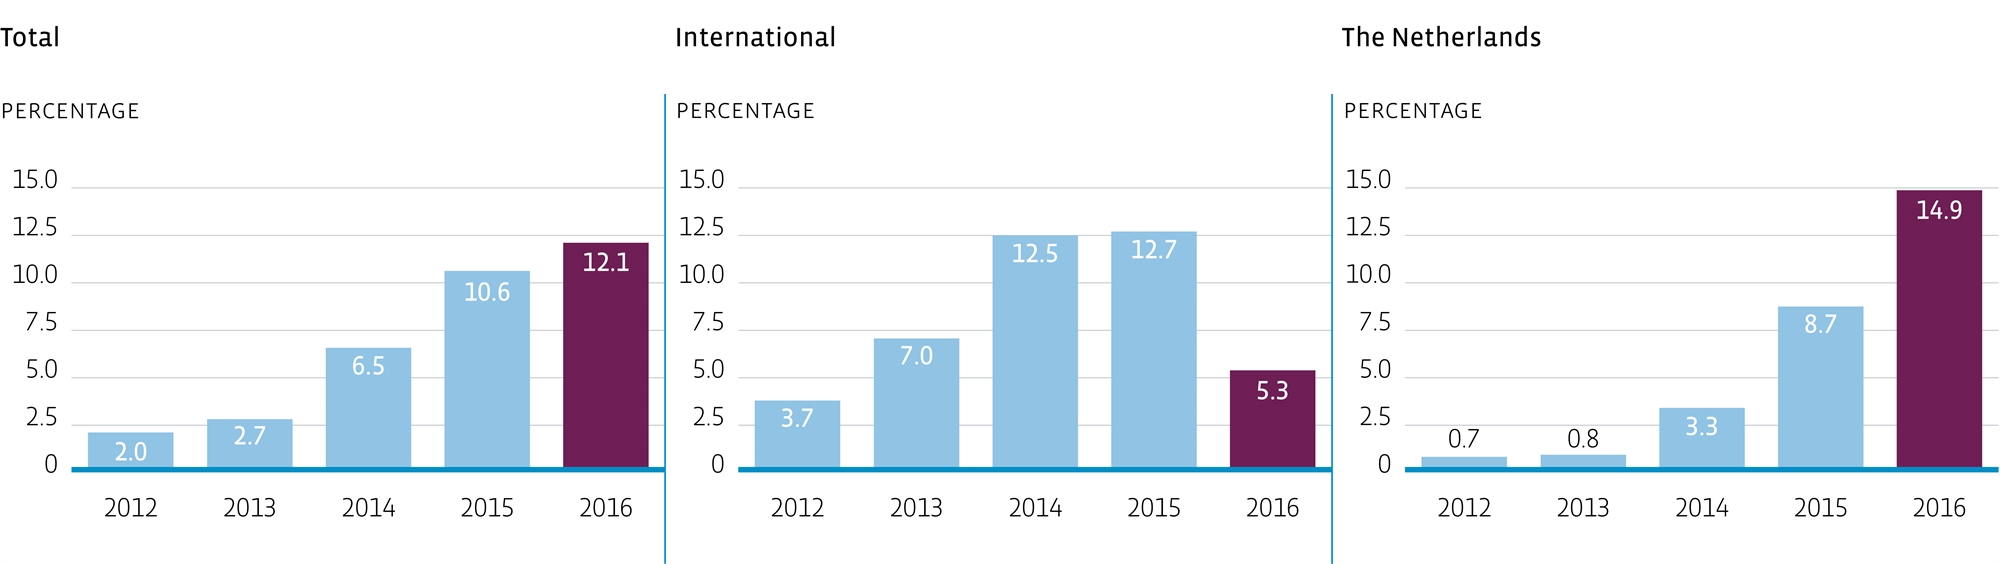
Return on assets under management
(excluding forex)
Transactions > € 30 million
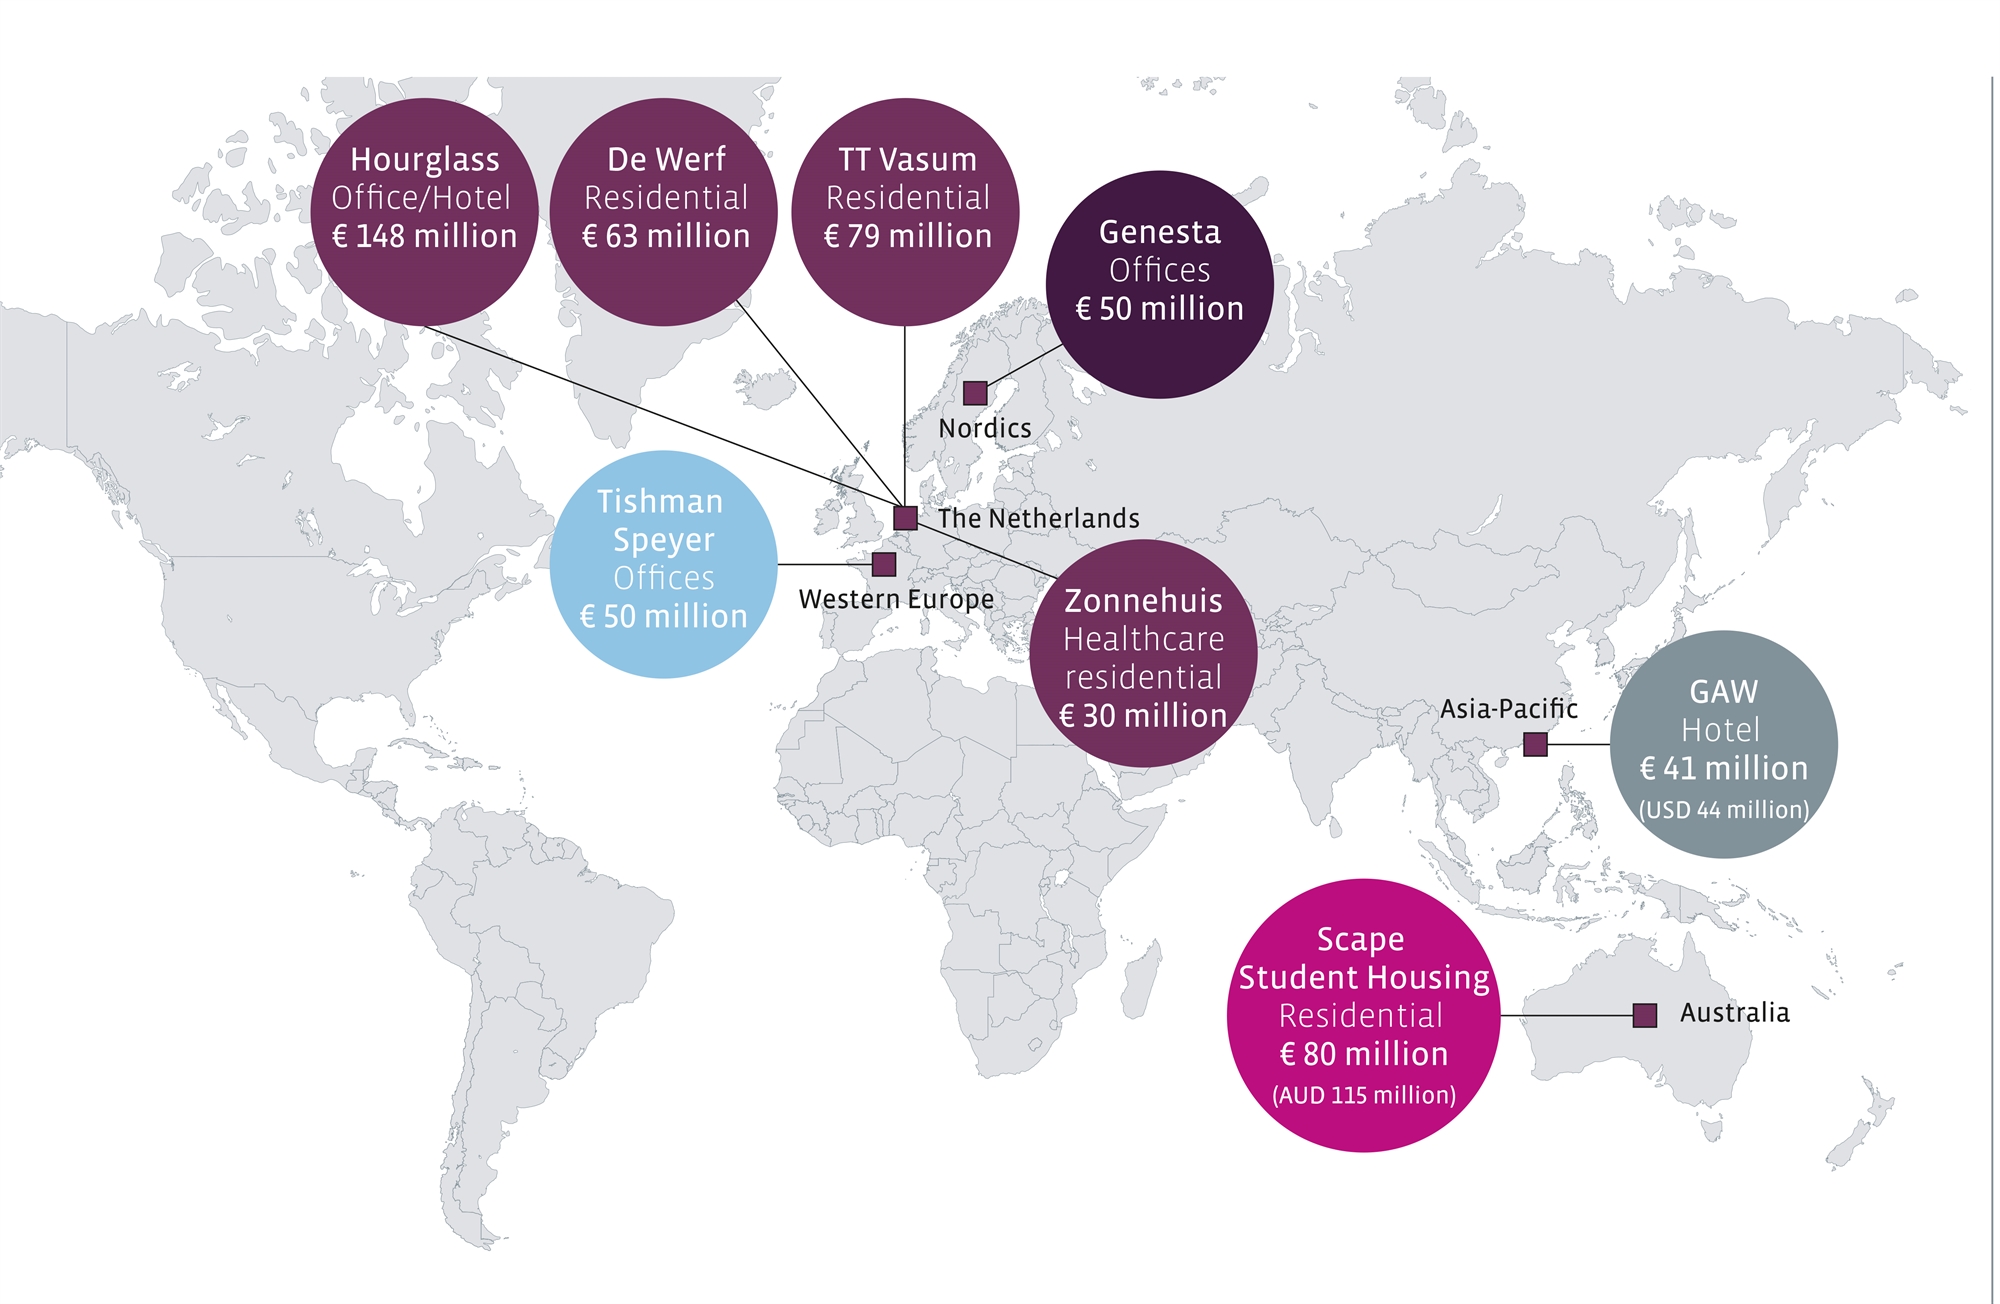
Transactions
x € million
Transactions | 2015 | 2016 |
International | | |
Europe (excl. The Netherlands) | 124 | 121 |
North America | 70 | - |
Asia-Pacific | 66 | 158 |
| | 260 | 279 |
| | | |
The Netherlands | | |
Residential Fund | 466 | 249 |
Retail Fund | - | 41 |
Office Fund | - | 131 |
Hotel Fund | 24 | 65 |
Healthcare Fund | 32 | 47 |
| | 522 | 533 |
| | | |
Total | 782 | 812 |
Key information over five years
All amounts in € thousands unless otherwise stated
| | 2012 | 2013 | 2014 | 2015 | 2016 |
| | | | | | |
Number of shares (actual) | 225,000 | 225,000 | 225,000 | 225,000 | 225,000 |
| | | | | | |
Net result | 3,034 | 4,903 | 3,173 | 4,422 | 2,595 |
Per share | 13.48 | 21.79 | 14.1 | 19.65 | 11.53 |
| | | | | | |
Assets under management | 5,826,789 | 6,060,282 | 6,700,206 | 7,495,325 | 8,456,869 |
| | | | | | |
Total assets | 23,336 | 28,517 | 30,770 | 33,010 | 36,889 |
| | | | | | |
Shareholders’ equity | 19,110 | 24,013 | 27,186 | 29,422 | 29,317 |
Per share | 84.93 | 106.72 | 120.83 | 130.76 | 130.30 |
| | | | | | |
Solvency ratio | 82% | 83% | 88% | 89% | 79% |
| | | | | | |
Management fee income | 27,115 | 27,324 | 27,854 | 30,503 | 30,722 |
| | | | | | |
Personnel costs | 17,278 | 16,815 | 17,014 | 17,959 | 19,276 |
Number of FTEs (year-end) | 129.4 | 122.6 | 128.0 | 131.1 | 136.6 |
Personnel costs per FTE | 133.5 | 137.2 | 132.9 | 137.0 | 141.1 |
Fee per FTE | 209.5 | 222.9 | 217.6 | 232.7 | 224.9 |
Corporate Social Responsibility